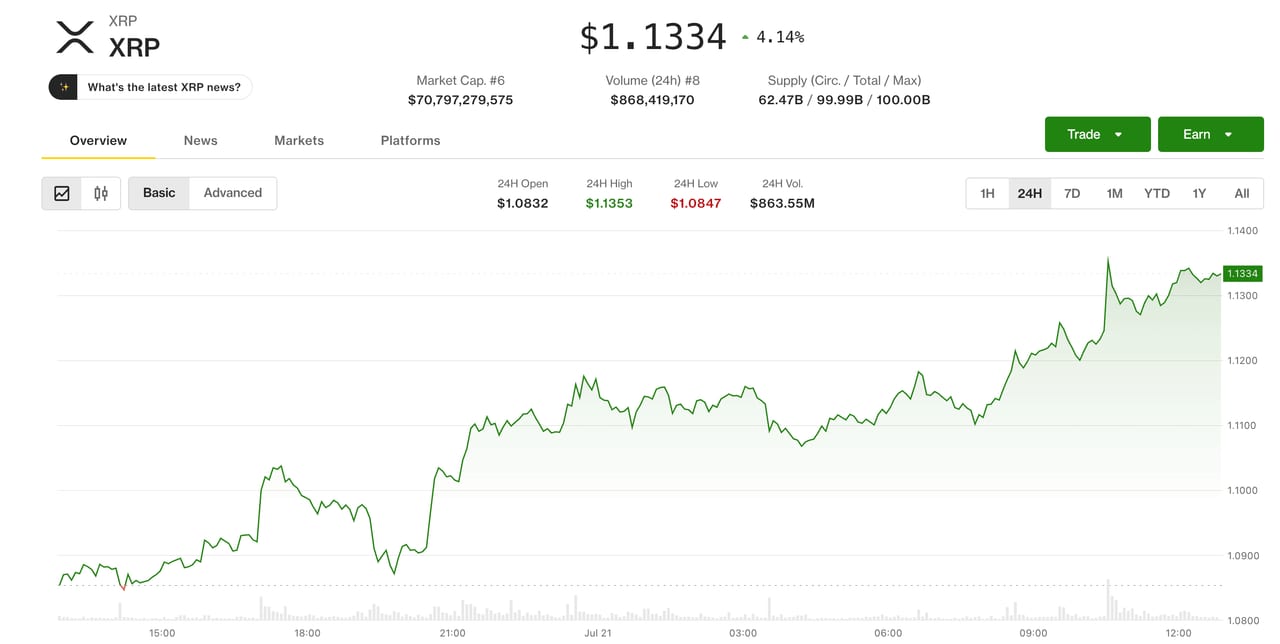
Key facts
- XRP's price increased by approximately 4.6% in 24 hours, reaching near $1.13.
- Traders are observing a potential breakout from a symmetrical triangle pattern on the hourly chart.
- A sustained break above $1.13 could target $1.35.
- XRP is still trading within a descending channel on its daily chart, capping rallies.
- Key resistance levels are identified between $1.24 and $1.28.
- Support is found between $1.02 and $1.06.
XRP experienced a notable price increase, climbing approximately 4.6% over a 24-hour period to trade near $1.13. This movement has captured the attention of traders who are monitoring a potential breakout from a symmetrical triangle pattern observed on the hourly chart. A sustained push above the $1.13 level could signal a rally towards $1.35.
However, the broader daily chart perspective indicates that XRP is still navigating within a descending channel, a pattern that has previously capped upward price movements for several months. Analysts are closely watching the resistance zone between $1.24 and $1.28, which aligns with the upper boundary of this channel and key moving averages. On the support side, the $1.02 to $1.06 area is considered crucial; a failure to maintain this zone could expose XRP to further declines, potentially towards the $0.88 to $0.92 range.
Volume increased during the breakout attempt, suggesting growing interest. While the short-term hourly chart shows bullish consolidation, the daily chart suggests caution until the larger descending channel is decisively broken. The market is currently characterized as a short-term breakout attempt within a larger bearish structure.